From chart to lead, in one click
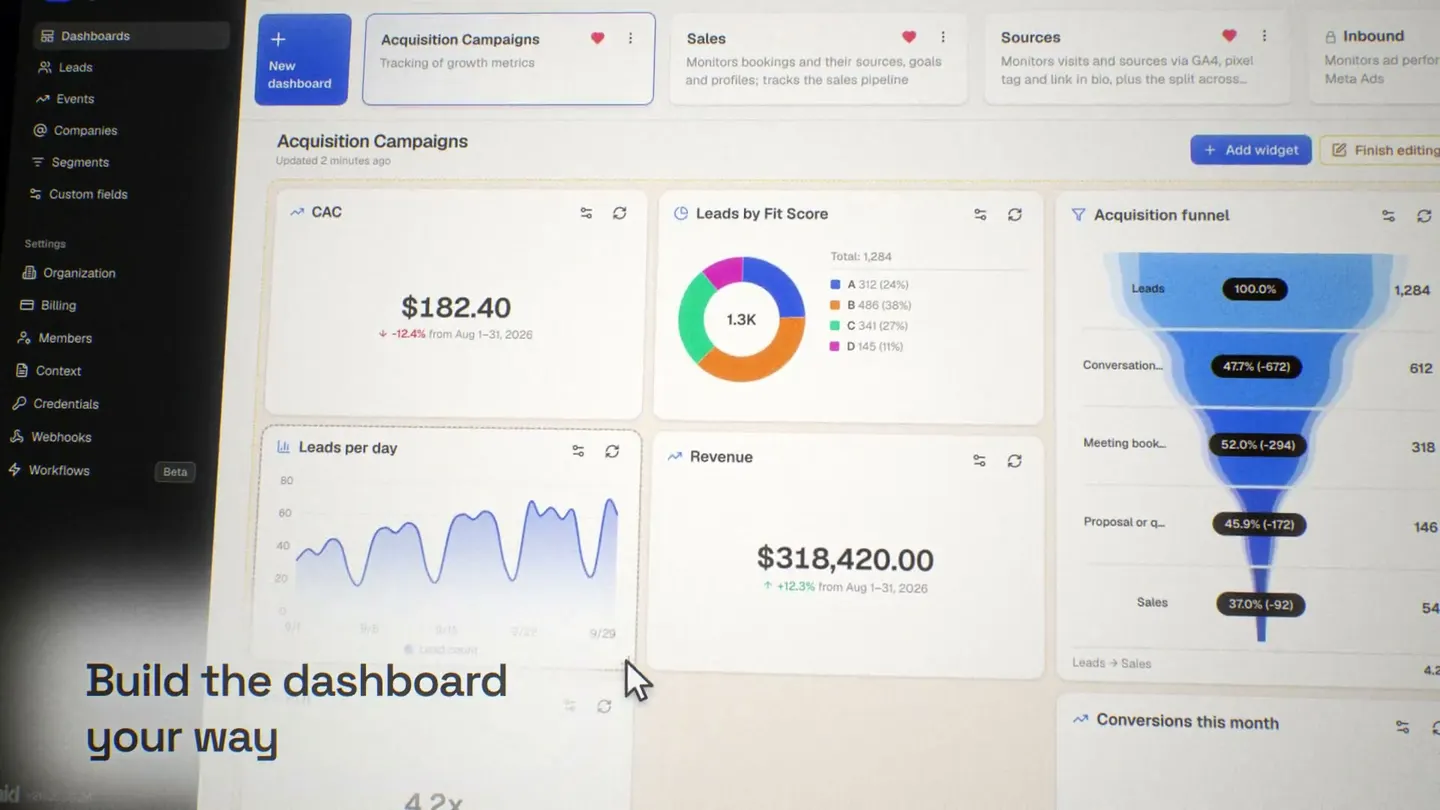
Build dashboards with your marketing and sales data, view your key metrics in near real time and click any number to see the people behind it.
Make it your own
In edit mode, drag and resize the widgets. Every dashboard takes the shape of your operation.
Add widgets
Counters, series, pie, funnel and tables, with lead and event data, Meta Ads, Google Ads, Google Analytics and LinkedIn Ads.
Interactive charts
Click a point on the chart or a slice of the pie and open the list of leads behind that number.
Every lead's journey
Open the lead's record and see the events and UTMs of every step, from the first visit to the conversion.
AI agents
Your agent builds the dashboard
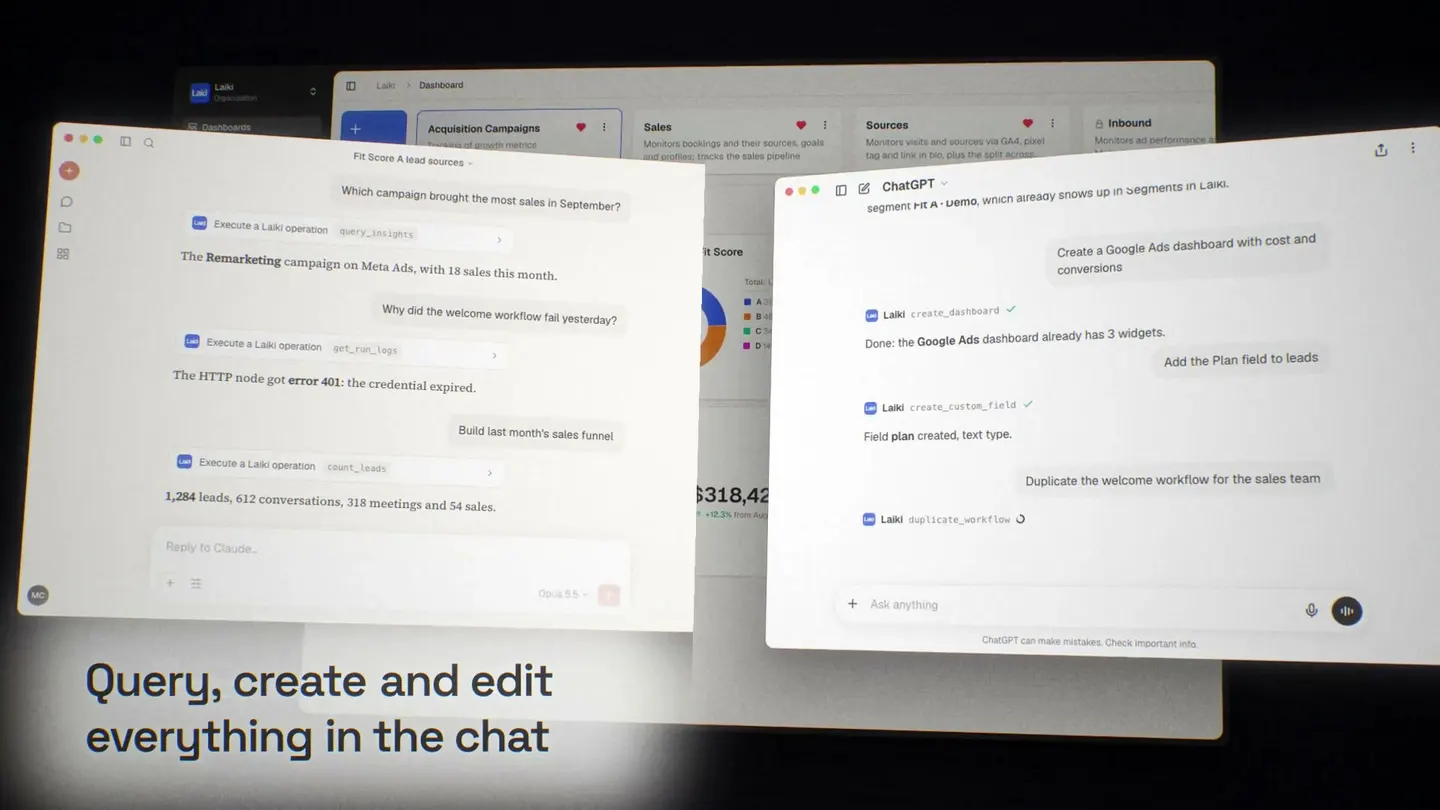
Just describe the plan: the metrics, the sources and the period. The agent creates the dashboard and the charts in Laiki through MCP, and you review them before publishing.
Turn your customers' signals into metrics
Build dashboards with dynamic widgets from the data centralized in Laiki. Combine ads, CRM and automation metrics, follow funnels and growth metrics and make decisions without opening a spreadsheet.
By hand or with your agent
Build your dashboards by hand or ask your favorite AI agent: funnels, tables, line charts and calculated metrics are ready in a few minutes.
Date filters
Cohort, creation date and last event: Laiki has ready-made rules to organize the data the way your operation works. Each dashboard answers the right question, for the right period.
ID matching
Laiki recognizes the same person across different tools: the emails, phone numbers and IDs of one lead become a single profile, automatically.
Media attribution
Laiki records and organizes each person's UTMs, so you get a more complete view of attribution. Last-click or first-click, follow the entire journey, person by person.
Simplified data viz
From detailed technical reports to broader dashboards for managers and directors. Build different analytical panels for different roles. Laiki adapts to what each person needs to see.
Monetary data
Laiki supports monetary values. Build metrics and KPIs using the monetary values of your events, your ad platforms or even custom fields.
No token limits
There's no limit on dashboards and no cost per user. Build your dashboard and use the data as often as you need, without paying for an extra token.
Lead explorer
Click the charts and see the people behind each number. Knowing who is in each report gives you confidence in what you're looking at.
Never make another decision in the dark
We set up your data operation alongside you and get your team ready to decide. Book a conversation and try it with your own data.