Laiki dashboards: dynamic and built on already organized data
See how Laiki dashboards are dynamic and built on already organized marketing and sales data, with no manual spreadsheets.
Published on
6 min read

Laiki dashboards are dynamic panels, built with configurable widgets from the marketing and sales data already centralized on the platform. Unlike a generic dashboard that only draws charts on top of whatever is already ready, the Laiki dashboard is born on a database that has already resolved lead identity, media attribution, and data organization before the first widget even exists.
Why dynamic is not just a nice word
A dynamic dashboard updates itself, pulling data straight from the source, and reacts to filters without manual rework. This is only possible because, behind the dashboard, the media, CRM, and automation data have already been unified in a single infrastructure. A pretty dashboard on scattered data is still scattered data, now in color; what makes the Laiki dashboard different is what supports it underneath, not just the look.
This changes the day-to-day maintenance of the dashboard. A dashboard built on manually exported spreadsheets requires someone to update the source file before the chart makes sense again. A dynamic dashboard does not depend on that step: the widget queries the organized source directly, and the number on the screen already reflects what has happened so far.
The real features behind the dashboard
Profile view separates what an analyst needs to see from what a director needs to see, without forcing the same technical, detailed dashboard on both. From dense reports for those who investigate the whole funnel every day, to broader dashboards for those who decide on investment and priorities, the same database supports both formats, each configured for the right audience.
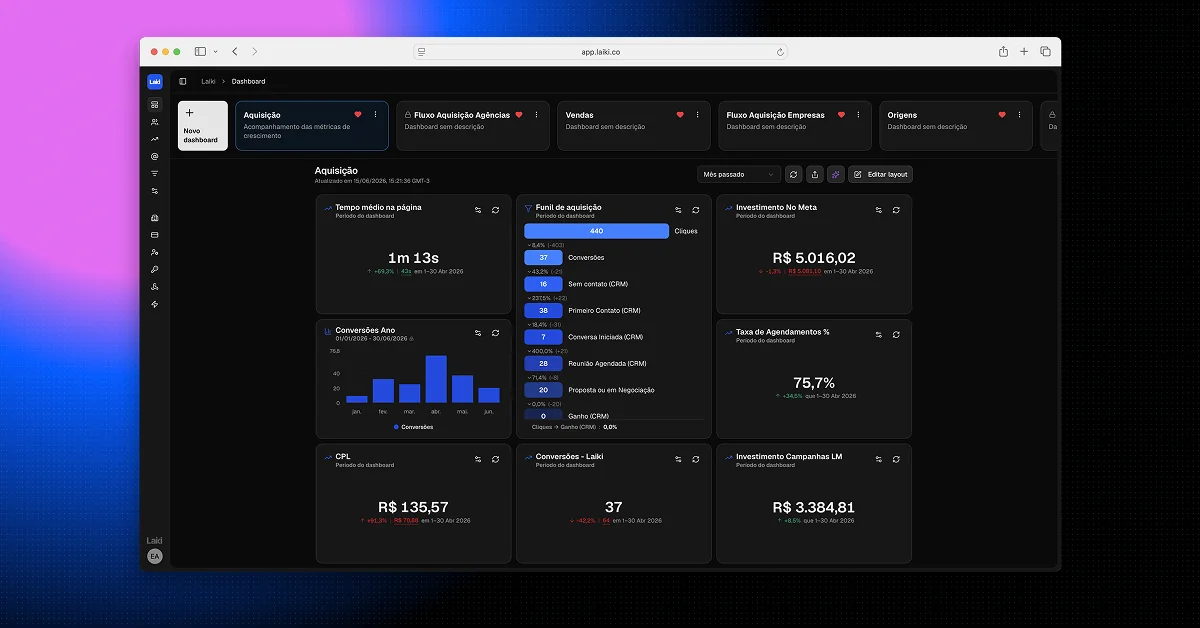
Date filtering goes beyond picking a period on a calendar. Cohort, creation date, last event: each rule organizes the data according to the right question, instead of forcing every slice into the same date criterion. A lead capture campaign, for example, may need analysis by cohort, while a recurrence metric calls for a cut by last event.
The ID Combiner shows up in the dashboard without anyone having to think about it. When the same lead has different emails, phone numbers, and WhatsApp numbers, the system recognizes it is a single person, which avoids counting the same lead two or three times and inflating metrics like CAC without anyone noticing. This is a common mistake in generic dashboards: the count inflates because nothing behind them resolves duplicate identity.
Media attribution organizes UTMs automatically, with a first-click or last-click view, and the dashboard is born already reflecting that organization. Instead of discovering the hard way that tracking was incomplete, the dashboard already shows the lead's journey with the right parameter, lead by lead.
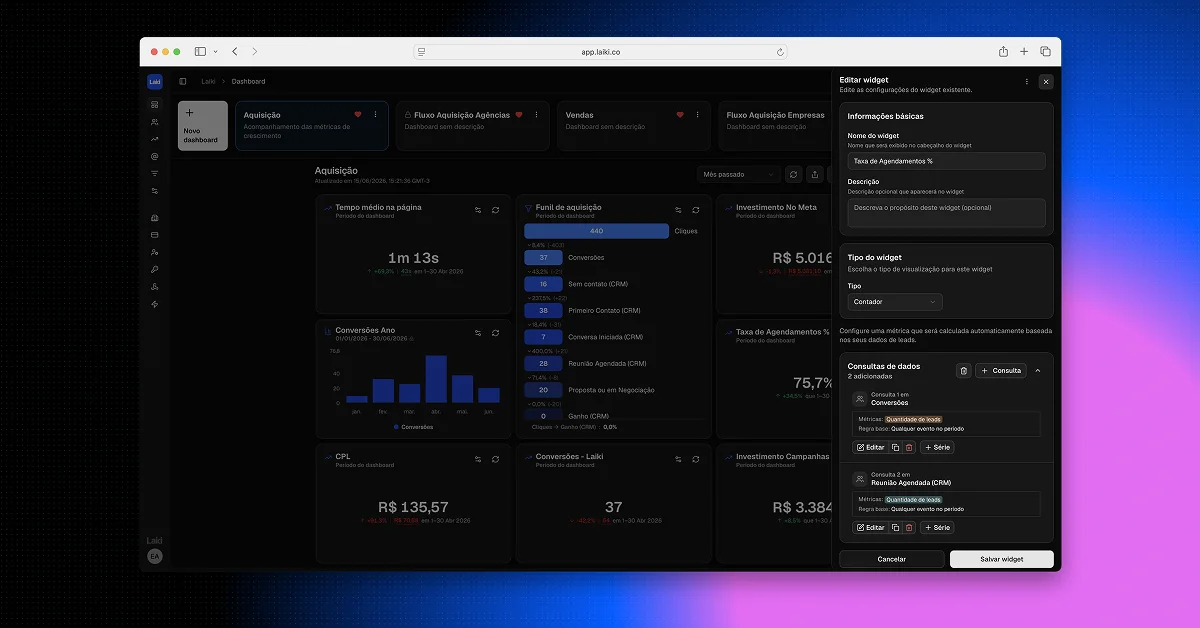
Simplified data viz means building a widget once and reusing it in as many reports as needed, without starting from scratch with every new dashboard. Monetary data enters the metrics natively, so indicators such as average ticket or revenue by channel do not require a spreadsheet hack to calculate value on top of the right event.
The Lead Explorer makes the analysis interactive: instead of looking only at the final number on the chart, you can click and see exactly who the leads behind that number are, with confidence in what is being shown. This changes how you investigate an anomaly: instead of doubting the number, whoever looks at the dashboard checks who is behind it.
And, unlike an external AI agent, querying the dashboard as many times as needed does not generate a variable cost per query: you build the dashboard once and query it as much as you want, without paying extra tokens for it.
Security of the data shown in the dashboard
A dashboard shared with the whole team raises the same question as any sensitive operational data: who sees what. At Laiki, data isolation happens per organization at the database layer, with AES-256-GCM encryption and audit logs, which means the dynamic dashboard does not give up the same protection the rest of the platform already has.
When the dashboard is no longer enough
Even when dynamic, a dashboard covers what has already been designed as a widget. When the question changes, such as understanding why a specific lead went cold or cross-referencing a slice nobody anticipated, the dashboard alone cannot answer it without someone configuring a new widget. That is where Laiki's MCP comes in, complementing the dashboard with an on-demand report, made on the spot, for the one-off question that is not routine. Both approaches use the same organized database; all that changes is the format for consuming the data. The article on when to use a dashboard or an AI report details this criterion.
How this shows up in practice
A classic end-of-month report shows a frozen photo: closed numbers, with no room to click and understand what is behind them. The dynamic dashboard swaps that photo for a live screen, where the same dashboard used on Monday morning reflects what happened over the weekend, without anyone having to update anything manually. This is especially relevant for those who follow a paid media campaign: a performance drop becomes visible the same day, instead of appearing only when the monthly report is put together.
The same logic applies to operations that already use multiple paid media sources (Meta Ads, Google Ads, LinkedIn Ads) and more than one CRM or sales tool. In these cases, the gain from having a single central dashboard grows, because the manual alternative of cross-referencing all of this in a spreadsheet becomes more and more expensive in time, and more and more prone to duplicate-count errors.
A real example
The case of Willian Martins, Marketing Manager at Dimas Construções, shows what changes when data leaves the spreadsheet and enters an organized database: centralization of data that used to be scattered, real-time analysis of indicators, and faster, more reliable decisions, exactly what supports the dynamic dashboard.
Frequently asked questions about Laiki dashboards
Do I need technical knowledge to build a dashboard in Laiki?
No. Widgets are configurable directly on the platform, without depending on a dedicated technical team.
Does each dashboard query have a variable cost?
No. Unlike an external AI agent, which charges for model usage on every question, the dashboard has no query limit and no per-user cost.
Does the dashboard replace MCP?
No, they complement each other. The dashboard covers the recurring metric; MCP covers the one-off question that changes every time.
Can I see who the leads behind a dashboard number are?
Yes, through the Lead Explorer, which lets you click on a chart and see the real leads attributed to that number.
Does a duplicated lead count the same leads again in a dashboard?
No, because the ID Combiner already resolves duplicate identity before the widget calculates any metric, so the same lead with a different phone and email does not become two records in the count.
What remains of this dynamic dashboard
A Laiki dashboard is not just a pretty screen: it is the visual layer on top of a database that has already organized lead identity, media attribution, and monetary data before any chart exists. Discover the Laiki platform and see how this works on the data your operation already collects.